Comprehensive media monitoring and insights with FloodTags
At FloodTags, we turn online media into reliable, real-time and historic insights on floods and other weather-related disasters. Our five core products provide tailored solutions for monitoring, analysis, validation, and decision-making — used by governments, NGOs, researchers, and insurers around the world. Whether you need fast updates during a crisis or detailed information for long-term planning, FloodTags helps you understand what’s happening on the ground, when and where it matters most.
Real-time monitor
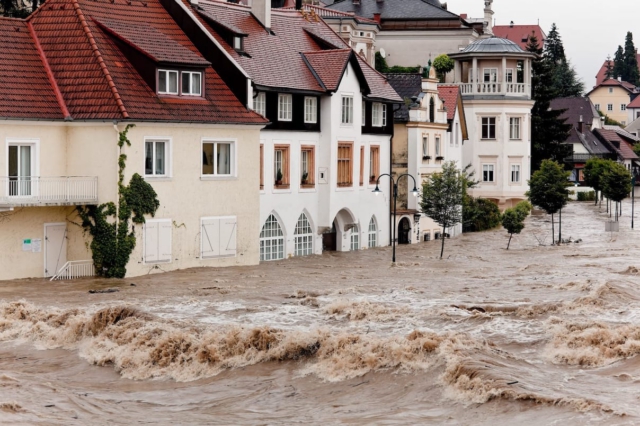
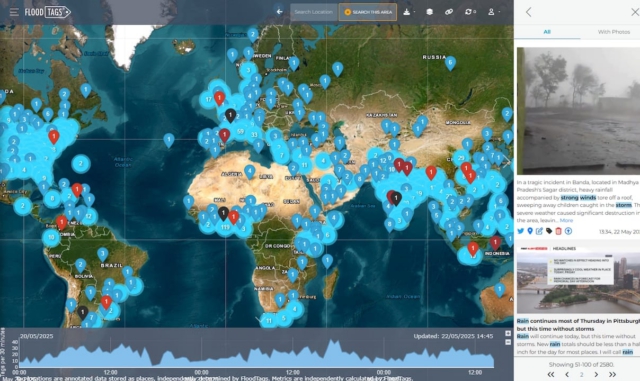
Monitor weather impact in real-time via your personalized dashboard. Data sources include BlueSky, X, YouTube, Facebook, Instagram and over 150,000 news sites, blogs, forums worldwide. Keep track of impacted locations, infrastructure status, system damages, impacts on-the-ground, public perception and more.
The interface features interactive maps displaying georeferenced data, graphs with detailed statistics, and side menus containing individual tags, event summaries, and additional statistics. A query function lets you search the data efficiently, with filters for geographic areas, topics, and relevance indicators. Content is delivered within seconds of being posted. FloodTags currently covers floods, landslides, mudflows, windstorms, snow, hail and wildfires.
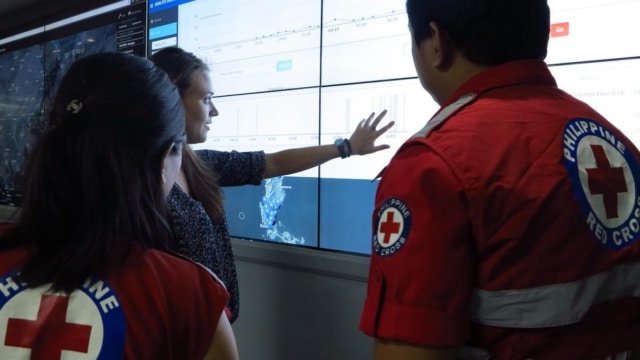
Access is provided via a website and API, under a paid subscription model. Clients include several meteorological services around the world, such as the Met Office in UK.
Specialized Information
- Floods and water depths
- Infrastructure status
- Damage and impact
- Public perception
- Locations and event times
Key Features
- Maps, graphs, and stats
- Filters and AI classifiers
- Global geoparsing
- Notifications and real-time access
- API integration
Situation Brief
The Situation Brief delivers fast, structured information on new weather impact events. It contains a concise yet comprehensive overview, covering five essential dimensions:
- Hydrologic Event Description: Key characteristics and dynamics of the event
- Locations: Identification of affected areas at city or regional scale
- Causes: Analysis of contributing factors, such as rainfall, infrastructure failure, or land use
- Impact: Summary of consequences for people, infrastructure, and services
- Stakeholders: Overview of key actors involved or affected
For the Situation Brief, FloodTags extracts and summarizes information from online media supported by advanced large language models, such as ChatGPT. The output is a 10–15 pages report with clickable links to original sources, supporting transparent, evidence-based decision-making. It is particularly suited for quick assessments, situational awareness, and the early stages of response – and planning.

Time-series
The timeseries offers a 10- to 20-year historical overview of weather-related impact events for any specific area or region worldwide. By systematically collecting and analyzing online media sources over time, FloodTags creates structured datasets that reveal patterns, frequencies, and trends in extreme weather events.
The standard deliverables include:
- Detailed data table (CSV) with event dates, locations, and source links
- A PowerPoint presentation with selected source excerpts
- A concise report explaining the methodology and key findings
Events covered include floods, landslides, mudflows, heavy rainfall, windstorms/hurricanes, snow, hail, droughts, and wildfires. Optional insights can be added on hydrologic causes, infrastructure performance, and impacts on people and the economy.
These time-series datasets are particularly valuable for model validation, system and risk assessments, baseline studies, strategic planning and policy development.
Detailed event report
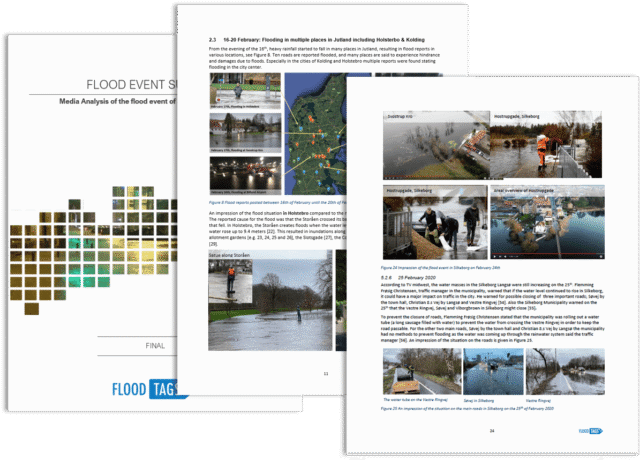
Where the Situation Brief offers a quick and concise overview of an event, the Detailed Event Report digs deeper, providing a more comprehensive and in-depth analysis of past weather impact events. It has detailed information on both the physical characteristics and societal dimensions of an event, including verified locations and estimated water depths, infrastructure performance and causes, sector-specific impacts such as road closures, public response and measures taken, involved stakeholders, and geolocated points linked to Google Street View.
Reports typically span 20–30 pages per event, and include maps, timelines, statistics, and storylines. All content is manually reviewed for accuracy. Reports are available for individual events or multi-year overviews, in English or any local language, and include full reference to original media sources.
The Detailed Event Report is intended for users who need high-confidence, evidence-based reporting on flood and weather impact events worldwide.
Manually validated data points
FloodTags provides manually validated geolocated data points that confirm the occurrence of weather-related events at specific locations. Each data point includes latitude, longitude, and a link to the original media source.
For flood events, additional detail such as estimated water depth can be included to help assess the severity of local impact. These data points are commonly used for model validation, remote sensing comparison, and risk analysis. By offering real-world confirmation of events, they support more accurate planning, forecasting, and emergency response.
The output is delivered as a CSV file, with each row containing the event type, coordinates, water depth (if applicable), and source URL