Using media to monitor droughts in Mali and California
Despite significant progress on drought physical representation through the improvement of satellite-based indicators, knowledge gaps remain on the link between drought physical assessment and its impacts on societies. This difficulty can be explained by the complexity of the phenomenon which propagates unequally in multiple parts of the hydrological system and creates a wide range of direct and indirect impacts. Also, the nature of those impacts strongly depends on the drought severity, the water management context and water demand of societies and vegetation during the period it occurs.
Online media presents the opportunity to study drought from an impact perspective by giving insights on when and where societies perceive an event and which of the drought impacts are currently felt on the ground. This novel approach presents numerous benefits, such as:
- Providing ground-truth data for data-scarce regions.
- Allowing calibration of current drought indicators and the post-validation of drought forecast.
- Possibility to produce a geo-referenced database of the impact of past and ongoing drought events in (near)-real-time.
This article describes two use-cases where FloodTags applied online media to detect and monitor droughts. In the first project, we use a Machine Learning framework to extract information on historical drought events from online news articles [1] and evaluated the accuracy of the drought detection [2]. The output of this project contributed to a collaborative project targeting drought impact forecasting in Mali. In the second use-case, we investigated the application of social media platform Twitter to detect and monitor drought in California [2].
Case Study A: Monitoring Critical Developments in the Delta (Mali)
With the majority of the population engaged in subsistence agriculture, Mali is suffering from recurrent water crisis threatening the livelihood and health of its society. To properly prepare and respond to these events, quantitative data on the ground situation are critical. However, the limited amount of weather stations available and the high precipitation gradient, contributes to the difficulty to timely identify drought, thus exacerbating the vulnerability to drought. Furthermore, currently available data from weather stations pose problems regarding its management and sharing between organizations in charge of disaster response.
ObjectivesOnline media present the opportunity to provide an efficient approach to detect and monitor drought in data scarce areas like Mali, allowing to build the foundations of a drought event database. Currently, most of the disaster database referencing drought in the Sahel region rely on manual input. This limits their usability due to errors and omissions, and their focus on large scale and/or long-lasting events.
Method and ResultsFor the online media analysis, FloodTags automated the extraction of drought-related information found in news articles. Using four online news media sources, FloodTags scanned about 600 000 news articles published between 2009 and 2018. The output of that process is presented as a table representing for each row an event found (see below Table 1). The data include reports of:
- Drought events and drought drivers; including the lack of rainfall, delay in the wet season and heatwave
- Drought impacts; including water shortages and restrictions, low water levels (in reservoirs, wells, aquifers or rivers), drying vegetation and soils, erosion issues, food insecurity, electricity shortages, crop losses and the number of people affected by the event.
- Official GeoName of the event location and its GeoName ID, allowing to easily map the data. References of the news article URL links are also added, allowing to consult the sources for verification.
Table 1: Event table sample for Mali

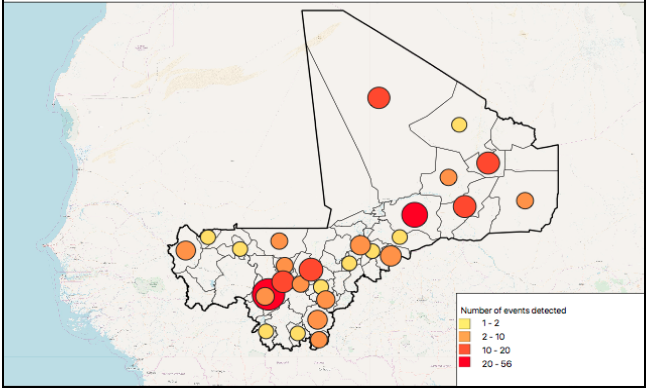
Overall, 243 drought event mentions were found in Mali. From those events, 88% reported events at a sub-national level or lower. The remaining are mentions of events at a national level. Also, 76% of the events were reported at a monthly temporal resolution. Overall, 57% included characteristics of the effect of the drought on society and 24% of the events reported factors potentially causing or exacerbating the disaster. Below Figure represents a visualisation of all the events found.

To validate the results obtained from the news articles, the events were compared to Water Storage Deficit (WSD) derived from the GRACE satellites. The indicator was used as a benchmark to the drought physical assessment. This choice was motivated by the opportunity to allow an integrated assessment of each component of the hydrological system. Ultimately, the results were moderately satisfying. The comparison with the WSD showed a high recall and low precision (Table 2). This suggests that although most droughts are identified, numerous false alarms are observed. Three challenges faced explains the low precision. First, we encountered the difficulty to properly match each event to their respective locations and dates within articles mentioning several dates and locations. Secondly, numerous articles showed coarse temporal expressions which would then result in lengthier drought events. Finally, we noticed an underestimation of the droughts durations from our benchmark drought indicator.
Table 2: Skills of the news article-based detection compared to the Water Storage Deficit (WSD) in Mali
| Precision | Recall | F-score | |
| Drought events, drivers and impacts | 33% | 73% | 46% |
Immediate improvement and application areasThis research constitutes the first attempt to detect and monitor drought using online news articles. Although the results presented several shortcomings, future development remains promising. Among on-going improvement, we are aiming to use a machine learning framework to match each event their respective additional details, such dates, locations and impacts. This upgrade will allow to improve the accuracy of the events reported. Potential application areas include:
- Disaster response organizations and water management organisations (Protection Civile, the Red Cross and Direction Nationale de l’Hydraulique) who can better respond to disasters such as droughts and water scarcity. These organizations lack actionable (near)-real-time data to request funds, shape their response and prioritize actions.
- Agricultural production support organisations: Agricultural credit suppliers and insurance firms currently lack detailed, trustworthy and cost-efficient information regarding farmers' assets and related risks. Consequently, these financial actors cannot profitably enter the market of small-scale agricultural business. With the on-the-ground information on drought impact, uncertainties are reduced, and farmers would get better access to credit.
- Agro-meteorological information NGOs (such as MyAgro): The Malian population relies on small-scale, rainfed agriculture and pastoralism. Several applications have been developed to provide the farmers with detailed weather services. Timely information from online media on extreme weather impacts can complement these services and assist both farmers and pastoralists to improve food security. initiative aiming to develop impact forecast method in Mali. In this collaborative project, FloodTags provided the online media analysis and Satelligence made vegetation health index (NDVI) to study historic drought events. Deltares integrated both impact data to allow to create an impact forecast model. Finally, Akvo developed a reporting application for mobile devices to improve measurements communication from meteorological stations.
Case Study B: Twitter for drought detection and monitoring in California
In recent years, social media drew interest as a possible new source of information on natural disasters such as wildfire, earthquake, floods, winter storms and heavy snowfalls. However, it was never used yet for the detection and monitoring of droughts.
ObjectivesThe study investigated the use of Twitter to detect and monitor drought events and their impacts from a human–centric perspective. For this goal, it is first necessary to understand how tweets relates to the physical parameters of drought. The Water Storage Deficit derived from the GRACE satellites was chosen as a drought indicator, thus, as the reference to the drought physical assessment. This choice was motivated by the opportunity to allow an integrated assessment of each component of the hydrological cycle. Due to the elusiveness of the drought phenomena, and the diverse drivers and impacts it may encompass, a large set of preselected drought-related keywords were monitored and analysed to define which keyword is the most suitable to encompass the drought phenomena. Three keywords categories were reviewed (Table 3): drought identifier, drivers and impacts.
Table 3: Preselected drought-related keywords
| Category | Keywords | Category | Keywords |
| Drought identifier | drought | Drought impacts | empty river flow |
| Drought drivers | heat wave | low river flow | |
| low rainfall | decline water level | ||
| lower rainfall | low water level | ||
| lower precipitation | decline groundwater level | ||
| rainfall shortage | low groundwater level | ||
| precipitation shortage | drying vegetation | ||
| Drought impacts | water scarcity | dry vegetation | |
| water shortage | drying crops | ||
| empty well | dry crops | ||
| low well | forest fire | ||
| empty spring | dry wetlands | ||
| low spring | drying wetlands | ||
| empty water reservoir | water restriction | ||
| low water reservoir | water shortage | ||
| empty aquifer | crop failure | ||
| low aquifer | crop loss | ||
| empty streamflow | drying soils | ||
| low streamflow | dry soils |
First, the tweets containing drought-related keywords were assigned a location using TAGGS, a geoparsing algorithms that enhances location disambiguation using both metadata and the contextual information of groups of tweets [3]. Then, the tweets were filtered to exclude all tweets that did not mention California or a geographic entity therein. Secondly, a blacklist was created to filter tweets containing the word “drought” in different contexts. Finally, the tweets monthly variations were compared to the GRACE indicator using an F-score.
ResultsThe F-score obtained are displayed in Table 4. The results validating the method was beyond expectation (82%), accounting for 44 months of drought detected by the online media system, where 39 months were confirmed by the referenced drought indicator (Water Storage Deficit).
Table 4: Skills of the tweet-based detection compared to the Water Storage Deficit (WSD) in California (USA)
| Precision | Recall | F-score | |
| Drought keywords | 89% | 76% | 82% |
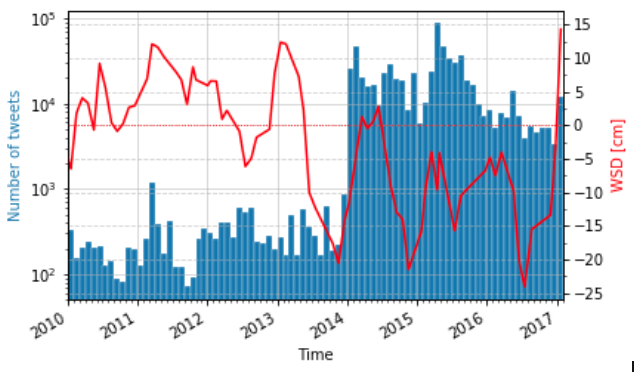
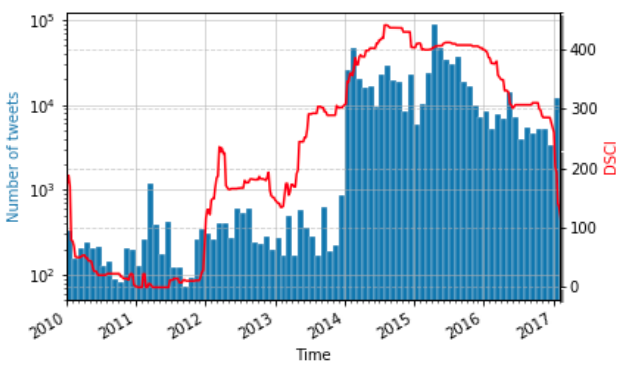
The visualisation of the tweets time series and the drought indicators can be found in Figure 2 and Figure 3. The tweets showed an exponential increase during GRACE-detected drought event, although with delay. The tweets also showed a progressive decrease during the drought event to ultimately rise at the end of the event. The drought drivers and impacts represented much fewer tweets. Their F-score was also lower (respectively 74% and 79%). However, the drought driver category did not display any response outside the GRACE-based drought event.

Figure 2 Time series of the monthly number of tweets containing drought-related keywords (“drought”, drought drivers and impact) plotted against GRACE Water Storage Deficit (WSD) in California (USA).

Figure 3: Time series of the monthly number of tweets containing drought-related keywords (“drought”, drought drivers and impacts) plotted against the US Drought Monitor Drought Severity and Coverage Index (DSCI) in California (USA).
Application areas areThe F-score suggest suitability to use the data for drought monitoring. These results are extremely valuable for the calibration and validation of current drought indicators, especially in the absence of any other from-the-ground data,. Furthermore, the method described in this research could be applied to real-time analysis. This suggests that this research could serve as the basis of building a global drought database able to timely detect drought from an impact perspective without relying on manual inputs nor model assumptions.
About FloodTags
By collecting news articles, blogs, forums, Twitter, Facebook public pages, FloodTags uses a state-of-the-art method in Artificial Intelligence to retrieve relevant information on natural disaster from online media. The information collected can then be visualized and analysed from an online dashboard. The data produced can be delivered on regularly and sent out to end-users through direct messaging. Moreover, FloodTags also developed a bot for end-user interaction to collect feedbacks on ongoing disasters. The bot can be used from Telegram, Facebook Messenger and soon WhatsApp.
Reference list
[1] Basar, M. E. (2017). Sequential Labelling with Active Learning to Extract Information about Disasters. Department of Artificial Intelligence, Radboud University Nijmegen, the Netherlands, Master’s Thesis.
[2] De Plaen, J. (2019). Online vs physical drought: Investigating the potential of an online media-based drought detection and monitoring system (Unpublished Master Thesis). Universiteit van Amsterdam, Amsterdam, Netherlands.
[3] de Bruijn, J., Veldkamp, T., Basar, E., De Plaen, J., de Moel, H., & Aerts, J. (2018, December). Towards a global drought detection and monitoring system using online media (Abstract). In AGU Fall Meeting.
[4] de Bruijn, J., Moel, H. De, Jongman, B., Wagemaker, J., & Aerts, J. C. J. H. (2018). TAGGS : Grouping Tweets to Improve Global Geotagging for Disaster Response. Journal of Geovisualization and Spatial Analysis http://doi.org/10.1007/s41651-017-0010-6