Impact forecast: Water-related diseases in Indonesia
By Jurjen Wagemaker (FloodTags), Bachti Alisjahbana (UNPAD), Gertjan Geerling (Radboud University), Ali Hürriyetoglu (Radboud University) and Konstantin Löser (Deltares)
Reliable health data is difficult to obtain in Indonesia especially aggregated data on a higher scale level such as provincial or national scales. This hampers adequate policy making and response to outbreaks by health workers on the ground. One of the acute sources adding to the total burden of disease are the water-borne and water-related diseases. These often have a seasonal character based upon the weather patterns and also affect whole communities at the same time.
This project started from the notion that floods can be mapped using data from Twitter and that floods may be correlated with tweets and/ or field data on water-related diseases. As data from public health is difficult to obtain, applying a social media analysis to acquire these data is an interesting prospect. We defined two research questions as:
- Can we find relation between floods and dengue & diarrhea, by using three datasets (Twitter data on floods, Twitter data on dengue & diarrhea, field data on dengue & diarrhea)
- Can we monitor floods to predict dengue & diarrhea, using Flood monitoring on basis of Twitter and the relation between flood and dengue & diarrhea.
After data collection and analysis we found an increase of the strength of the match (between flood tweets and health tweets) until day 6, at day 8 the match decreases, indicating that the highest response in health tweets occurs in general 6 to 7 days after a flood.
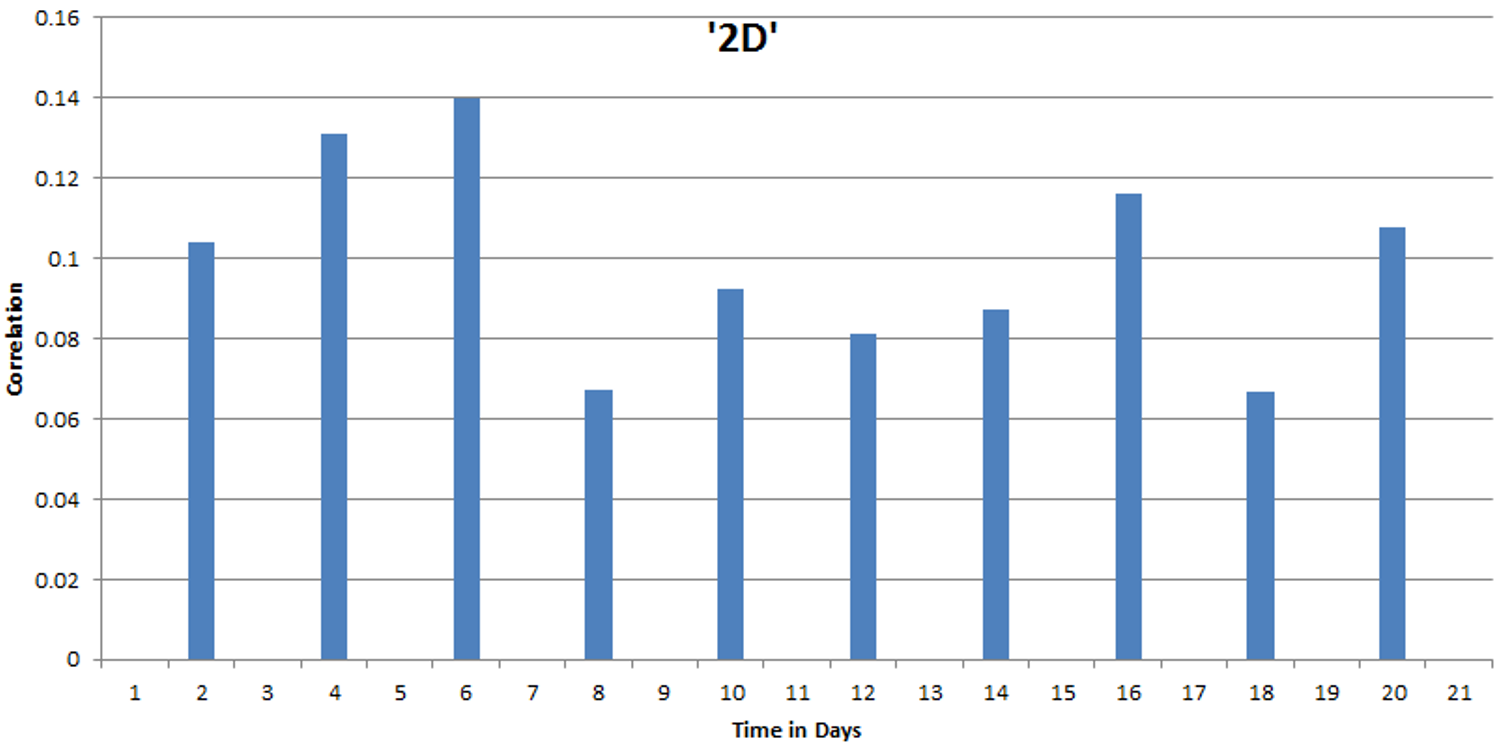 Figure 1. Strength of the “match” between flood twitter peaks and health twitter peaks for the whole dataset of the West-Java province. The strength of the match decreases after 6-7 days.
The correlation is not very strong, but nevertheless we can use it as a proxy of increased risk of water-related diseases outbreaks. We recommend however two major improvements for further development:
- During classification, a large amount of tweets ended up in the “mixed” class. The filtering of the tweets can be improved importantly, by further detailing the clustering approach and annotation of classes for floods as well as for health tweets.
- The geocoding of the tweets was done on the basis of simple enrichments with OSM. Geocoding can be improved significantly by adding more locations to the search database and validate the results.
ApproachWe used the Twitter API searching for keywords relating to Floods, Dengue and Diarrhea. They are banjir (for floods) and sakit, pusing, pening, nyen mastaka, sakit kepala, lieur, jangar, demam, panas dinoin, meriang, demam berdarah, tipes, tifus, tipus, mimisan, nyamuk, gigitan nyamuk, pendarahan, sembelit, keracunar makanan, disentri, muntah, muntah-, muntah, mules, sakit perut, diare, mencret, eneg, muntaber (for health). The period over which we collected data is October 2014 to July 2015. This yields a raw set of twitter data amounting to around 45 million tweets in the research period.
Tweets In order to get meaningful information from the tweets, they were clustered automatically based on content similarity into 100 bins. From these 100 bins sets of twenty random tweets were selected and were labelled manually into meaningful classes on floods, dengue and health. This was repeated until a satisfactory portion was manually classified to ascertain a reliable classification into tweet-classes about floods and dengue and diarrhea for various tweet sources like a person, news agent or organization. The resulting classifier was applied over the entire database.
The tweets in the useful classes were screened on location data, and if available only these tweets were selected for further analysis. Additionally, for tweets without geolocation data but for which the user set a home town, this home town was used as origin of location (assuming there is a good chance that ill people are at home).
The last step involved testing against available data from puskesmas and looking for relations between peaks in flood tweets and peaks in health tweets to establish a first prototype rule for predicting health impact based on flood tweets.
The results were implemented in a straightforward rule-based prototype “health risk map” available on www.floodtags.com/dengue-and-diarrheaforecast. More information on the classifier we used can be found on:
- Presentation of the interface: http://relevancer.science.ru.nl
- Open source python code: https://github.com/cengelif/Relevancer
- Demo presentation: Ali Hürriyetoğlu, Elif Türkay, Antal van den Bosch, Mustafa Erkan Başar, "Relevancer: Finding and Labeling the Structure in a Tweet Set", ATILA 2015, Antwerp, Belgium.
- Event Page: http://www.clips.uantwerpen.be/atila15
Analysis and ResultsThe figure 2 and 3 below show the results of the classification of all tweets that were gathered in the research dataset, spanning October 2014 to July 2015. More than 45 million tweets were “mined” using dengue and diarrhea related keywords in Bahasa Indonesia speaking territories. Out of 8.441.901 flood tweets, we found 424.109 “unrelated” and out of 36.852.695 health tweets, we found 31.574.557 “unrelated”. The tweets marked as unrelated were excluded from further analysis. In below graphs the results of classification of the remaining 8.017.792 flood tweets and 5.278.138 health tweets. The y-axis shows the amount of tweets, while the x-axis shows the tweet-classes.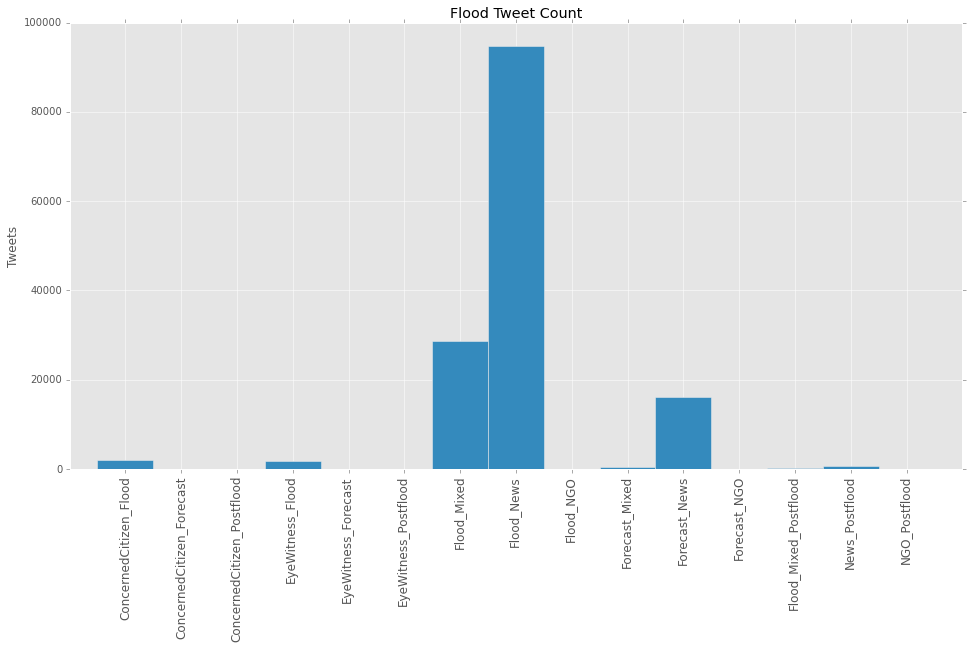 Figure 2. Number of tweets per flood class. The Flood_mixed and Flood_News classes contain the most tweets regarding floods.
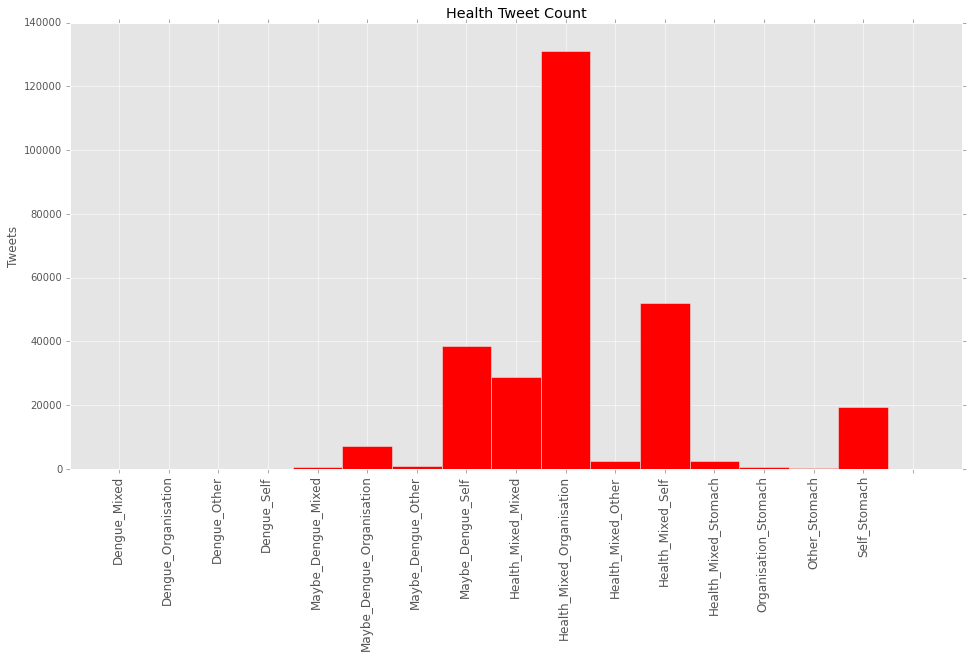 Figure 3. Number of tweets per Health class. In the final result, health classes were grouped to obtain enough spatial resolution.
Figure 2 also shows that three classes are left unused (NGO, Concerned Citizen and Postflood). Apparently, distinguishing these classes on the basis of the used features in clustering is difficult. In below table the validation results for the flood classifiers:
Table 1 and 2: In below table the validation results for the flood classifiers: 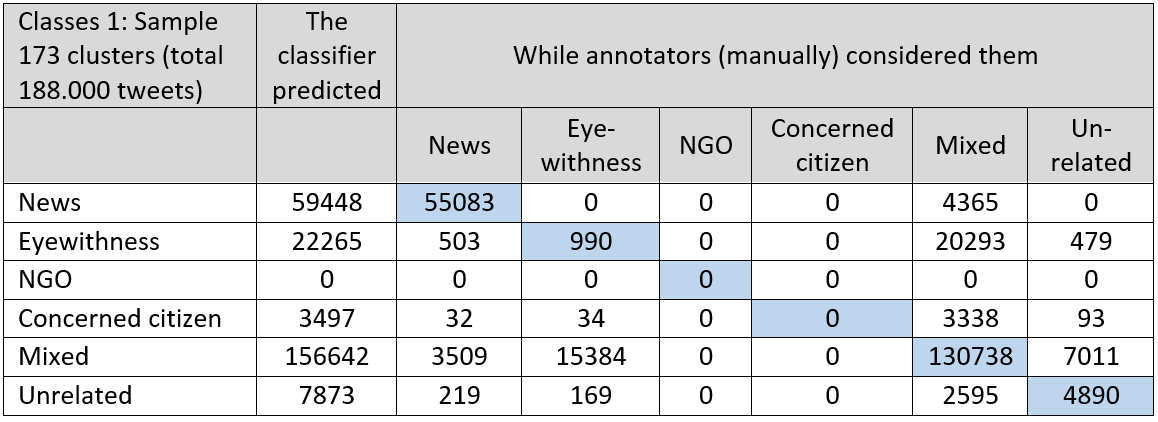
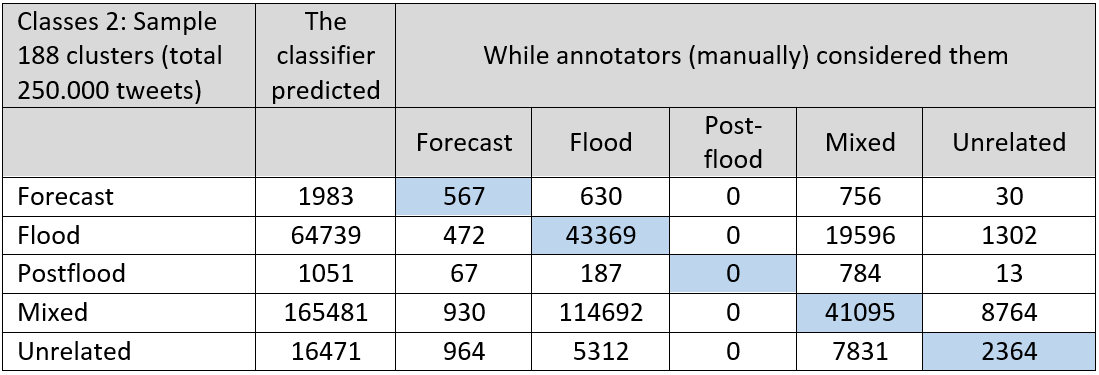
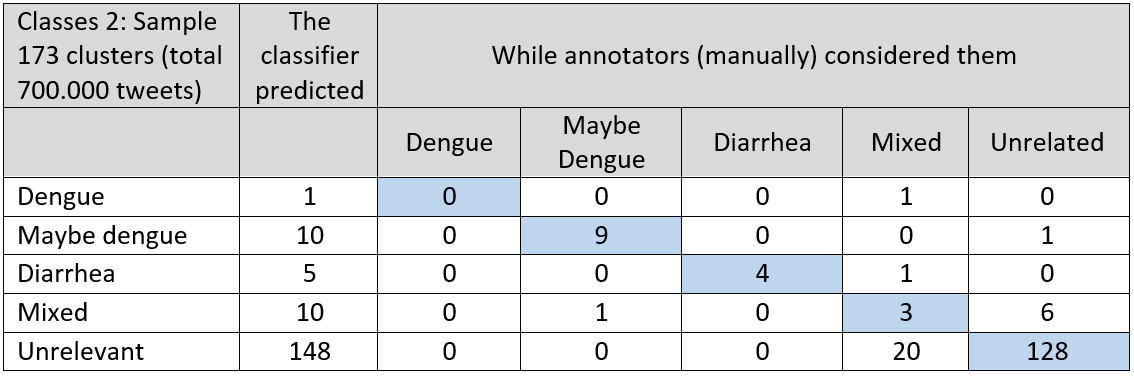
Table 3 and 4: Validation of the health classifiers
We used Method 3 to find geo-locations for the tweets. Out of 8.017.792 flood tweets, we could find a location for 623.541 tweets. And from a total of 5.278.138 health tweets, we found a location mark for 279.848 of them. After this step, we finally obtained a flood tweets dataset and a health tweets dataset with the date, location and flood or health (dengue and diarrhea) classified tweets. An example of this data is shown in figure 4 for the Bekasi district on Java Island. The number of flood related tweets is much higher than the number of tweets related to dengue or diarrhea. Therefore, the y-axis of flood tweets is on the left (with highest peak up to 13.000 tweets on a flood printed in blue) and the y-axis of the health tweets is shown on the right (up to 280 tweets for a major peak shown in red). As a future analysis option we also show the rainfall as measured by satellite data.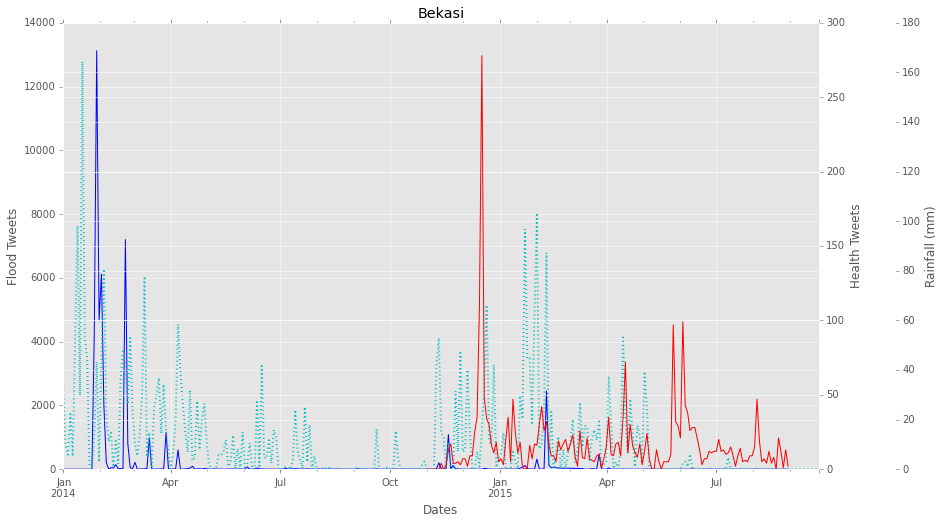 Figure 4. An example from the Bekasi district of the number of flood tweets (blue; left y-axis), number of health tweets (red; right y-axis) and satellite derived rainfall data (dotted line; second right y-axis).
We expected a disease (dengue or diarrhea) to emerge some time after a flood. So, in our prototype analysis, we tested for the best possible match between floods and health peaks. To determine the time at which a health effect emerges after a flood, we shifted the flood tweets in different steps of 2 days and tested the “match” (i.e. cross-correlation) between flood twitter peaks and health twitter peaks at every step.
Figure 5 clearly shows and increase of the strength of the match until day 6, at day 8 the match decreases, indicating that the highest response in health tweets occurs in general 6 to 7 days after a flood.
Figure 5. Strength of the “match” between flood twitter peaks and health twitter peaks for the whole dataset of the West-Java province. The strength of the match decreases after 6-7 days.
The map of the West-Java province shows the spatial variability of the strength of the match between floods and health after a 7 day shift, see figure 6. Stronger colors indicate that the correlation is higher after a shift of one week for certain locations. For example, Kota Cirebron has a correlation factor of 0.6. The variability of the correlations is interesting and depends on various factors that can be researched in the future, such as: there is a variation in the available tweets per district and this influences the ability to correlate peaks; different regions might have different relations between water and health like coastal regions versus upland regions.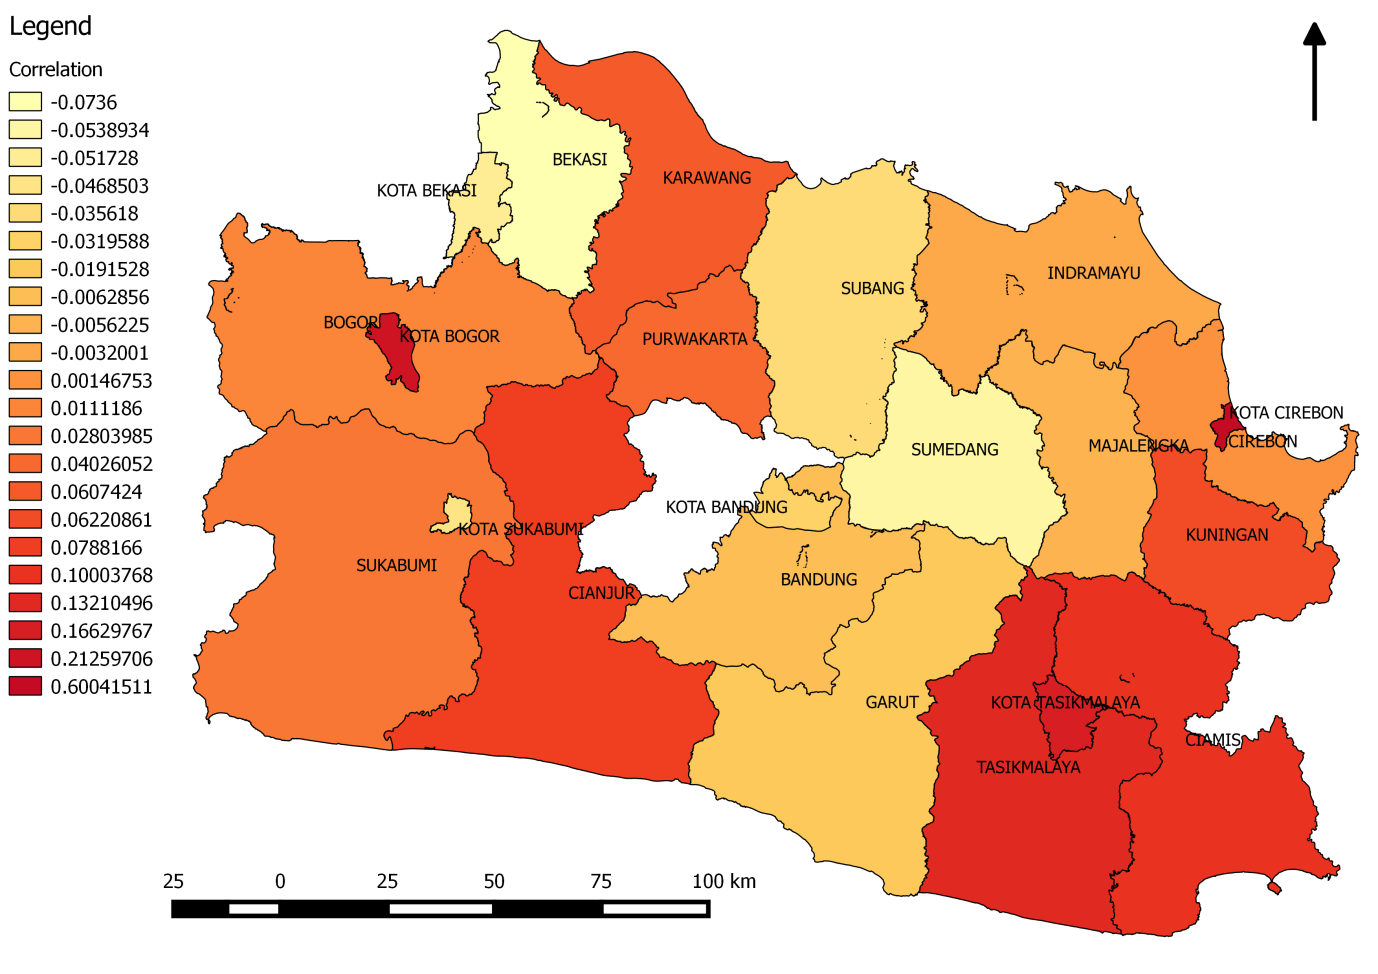 Figure 6. Strength of the “match” or cross-correlation for districts in West Java province for a 7 day time lag between flood and health incidences.
Based on our analysis shown above, we developed a prototype live forecast map, based on the relation we found (time lag) between a flood twitter peak occurrence and a health peak twitter occurrence. Our rules for the prototype are: A flood peak is defined as a peak when the tweet count is 2 times higher than the standard deviation of the previous week. This gives a health warning for that district for the next 7 days.
Conclusions and outlook
The main findings are:
- We were able to classify and map dengue and diarrhea related tweets.
- We were able to classify and map flood tweets.
- The flood and health tweet peaks for West-Java showed a relation that was strongest between 6-7 days after a flood event.
- Based on the classification and relation we were able to deliver a prototype health forecast.
- A large amount of tweets end up in the “mixed” class. Method 2 can be improved importantly, by improving the clustering techniques and annotation of classes for floods as well as for health tweets.
- For a large amount of tweets, we were not able to find geocodes. Also, we could not do a sound validation of the found geocodes. Method 3 can be improved, by improving the geocoding techniques and validating its results.
It is our intention to further research the possible relations between water and health in a 4-year PhD project both at UNPAD and the Radboud University in collaboration with Deltares (NL), the Dutch Royal Meteorological Institute and Floodtags. At the time of writing early possibilities for this are explored. The aim is to refine the prototype and to connect to potential users of this information, including the UN Pulse initiative.