
Flood History for 13 African cities
Increasing urbanization is transforming the planet. For the first time in history, the urban population exceeds rural areas. Well-managed urbanization can help reduce poverty and increase prosperity, as cities can accelerate growth, attract investment, spur innovation and enhance productivity. On the other hand, poorly managed urbanization can exacerbate existing challenges, and leave cities more vulnerable to natural hazards, as most global urban growth takes place in hazard-prone areas along rivers and coastlines. To solve these issues, forward-looking planning and strategic capital investments are critical to both strengthen resilience and improving the quality of life in cities. To achieve this goal, the City Resilience Scan of the Global Facility for Disaster Reduction and Recovery (GFDRR) of the World Bank focused on providing task teams and cities with a package of statistics, maps and visualizations that can kick-start a conversation around potential investments to improve urban resilience.
Among the possibility to improve resilience in cities, attention to urban floods is a big part of that discussion. However, it is generally very difficult to get a good overview of past floods in cities. By generating intra-city tables and flooding maps of thirteen African cities, FloodTags supported this initiative. The study aimed at identifying focus areas by analyzing flood event trend in the last decade. To do so, we researched whether local news articles can provide better intra-city information as opposed to national news articles. Following this analysis, a Machines Learning framework was applied to detect flood events, their location, timing and impacts. After the creation of flood event database, the events’ locations were geolocalized onto maps for the Resilience Planning Workshop.
Harnessing the potential of online news mediaIn the last decade, online media gained traction as an effective source of information on natural disasters. Several reasons justify this interest in comparison to satellite imagery. First, the quality of the data is not compromised by cloud nor ground cover. This aspect is even more relevant in the case of flood in urban areas. Secondly, online media provides (near)-real time opportunities and offers high temporal resolution and continuity of record. Thirdly, the accessibility of the data allows large volumes of content at a fraction of the cost of remote sensing data, spatially covering the habitable Earth. The procedure developed for this project was to first collect news articles reporting floods in thirteen African cities. In total, 1.4 million news articles from 56 online news media websites were collected and filtered.
Availability of flood reports in local vs national newspaperFirst, we investigated the information availability of flood-related articles in French and English for each city. Then, we determined the number of articles containing sub-city references (i.e. street names or district names) among those articles (Figure 1).
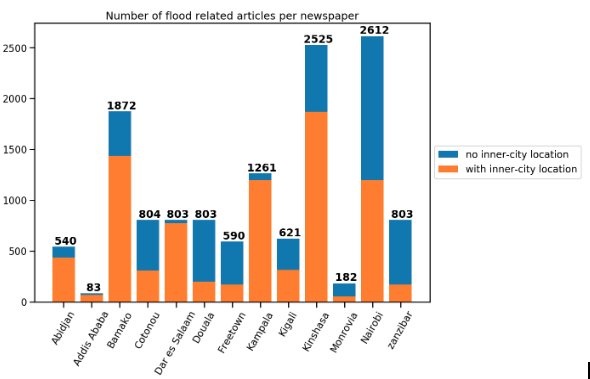
Figure 1: The number of articles containing at least two flood-related keywords per city. These articles are then split into two categories. First, the articles containing keywords on locality, i.e. street names, district names of the corresponding city or the name of the city itself (orange). Second, articles containing sub-city level keywords (blue).
Figure 1 shows that the availability of online news articles containing flood-related keywords differs greatly per city, ranging from over 2612 articles in Nairobi (Kenya) to a mere number of 83 in Addis Ababa (Ethiopia). The main cause of this difference is the availability of online newspapers databases. Furthermore, countries with low scoring numbers can be found to have different languages dominating the local newspapers. This includes, for example, Amharic in Addis Ababa (Ethiopia) and Kinyarwanda in Kigali (Rwanda). The location details in the articles differ greatly over the newspapers as well. On the one hand, a possible explanation is in the usage of either local or national newspapers, where local newspapers are thought to have more detail on locality. Kampala is a great example of this. The newspapers that were taken into account are three popular, local newspapers of Kampala, resulting in a result where 92% of the articles containing flood-related keywords also contain the mention of local street or district name within Kampala.
This raises the question whether local newspapers can significantly improve the level of detail of location found in the news articles. Figure 2 strengthens this hypothesis by showing that the percentage of articles containing information on locality in local newspapers is significantly higher than that of national newspapers.
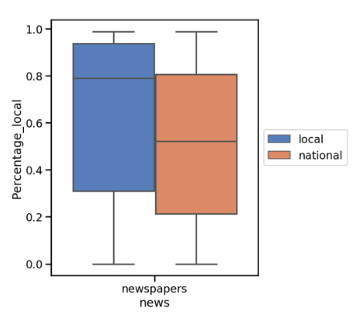
Figure 2 Boxplot of the percentage of articles containing at least 2 flood-related keywords that also contain street or district names of the corresponding city. Blue shows the local newspapers, orange the national newspapers.
One could ask why should we use national newspapers at all? The first reason is that their databases are larger and date back much further. The second reason is that most national newspapers can be found in English or French, whereas for some countries most local newspapers are written in local languages.
Information Extraction and event visualizationTwo separate algorithms operating in French and English were created and trained to automate the extraction of flood-related information from the news articles through the use of a Machine Learning framework.
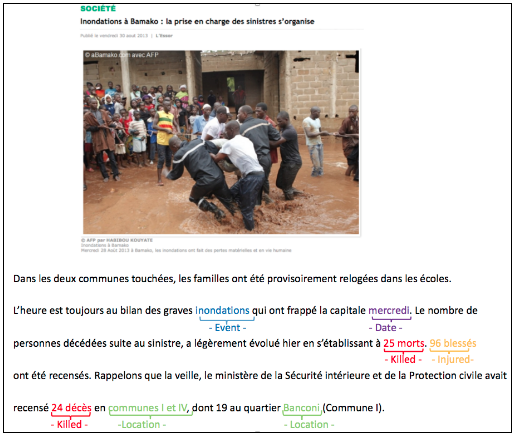
Figure 3: Illustration of the detection of relevant information using Machine Learning.
The algorithms aim to scan through the news articles to recognize and extract the relevant flood information. Figure 3 illustrates this process for one of the news articles analyzed. The output of this method consists of a table reporting each flood event detected in the news articles, its timing and location. A sample of this output from the illustrated article is displayed in Table 1.
Table 1 Sample of the event table for Bamako
| start | end | killed | injured | event | location | publication date | time | url |
| 2013-08-28 | 2013-08-28 | 25, 24 | 96 | inondations | Commune I | 2013-08-30 | mercredi | … |
| 2013-08-28 | 2013-08-28 | 25, 24 | 96 | inondations | Commune IV | 2013-08-30 | mercredi | … |
After the creation of the event tables, the locations for each event were matched to a list of gazetteers to retrieve the geographical coordinates of each location. This process allows us to create maps of each city to visualize the number of events detected throughout the past 10 years. In these maps, the total number of events is aggregated into their respective administrative areas.
Figure 4 displays an example of the flood map created for the city of Cotonou (Benin). This map was created after scanning twelves online news articles sources which accounted for 804 flood-related news articles. The algorithm detected twenty-three floods over the last decade which were mapped at the administrative levels. The map highlights the exposure of the North-Western district of the city bordering the Lake Nokoue. Particularly, the 9th “arrondissement” registers a total of seven floods.
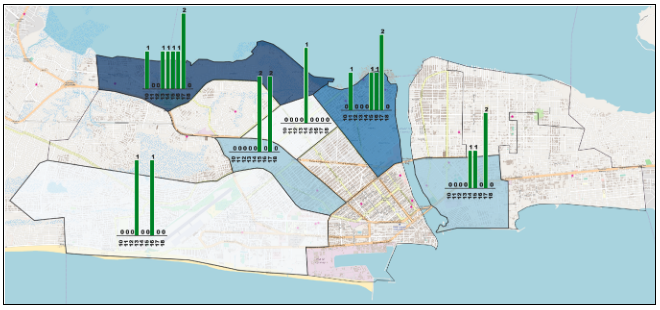
Figure 4: Floods detected from online news articles in Cotonou (Benin) from 2010 until 2018.
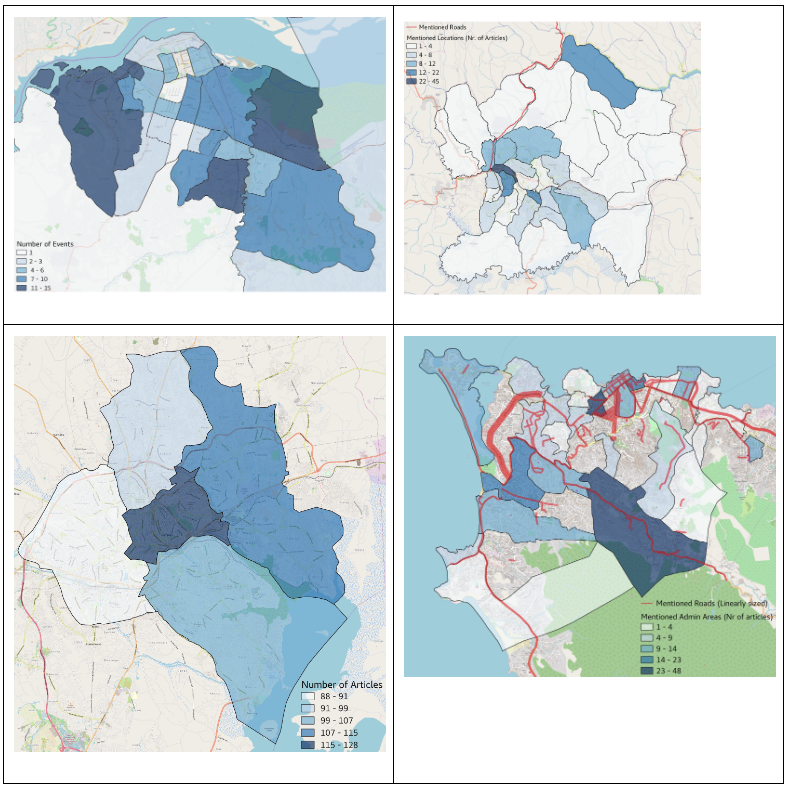
Figure 5: From left to right: Kinshasa (DR Congo), Kigali (Rwanda), Bamako (Mali) and Freetown (Sierra Leone).
Conclusion and immediate improvementsTo conclude, this project reemphasizes that online media analysis is a powerful tool to study floods in urban areas. Through this study, we also highlighted the added value of local news media which provide more detailed flood information for intra-city analysis. Such results provide valuable resources to strengthen both urban resilience and improve the quality of life in cities by calling attention on areas wherein strategic capital investment would have the most impact. Finally, through the comparative study of local versus national newspaper, we managed to identify key bottlenecks, such as the higher use of under-resourced languages in local news websites (e.g. Amharic in Ethiopia). Among the immediate improvement to address this issue, Floodtags is currently working on unlocking the potential of local news by allowing algorithms detecting floods in under-resourced languages to be trained in English. For instance, the training of an algorithm designed to extract flood information in Amharic could be performed on news articles translated into English.