Global Flood Monitor for the ID-lab of Deltares
The ID-lab of Deltares runs global hydrological and hydraulic models for flood monitoring. Twitter contains information about new flood events, as observed and reported by citizens, news agencies and other organisations. In this project, FloodTags and Deltares developed a flood detection on the basis of Twitter and connected it to the 'event server' in the ID-lab. As a result, Clients of the ‘event server’ can obtain timing and location of new floods as observed from Twitter (and take appropriate measures).
OverviewTo obtain a first global flood overview using Twitter, we were looking for a ‘certain flood’ approach. Meaning that we would be aiming to minimise false positives while allowing for a fair amount of false negatives. This is a reverse approach from what Floodtags had been doing so far (listening to all observations, ending up with a fair amount of false positives). Next, to make sure we could reach a global outreach, we decided on a relatively high aggregation level for the geocoding, being countries, provinces and large cities. Hereunder the steps taken:
- Set-up of a limited search query to obtain only those tweets that have high probability of being “flood event detectors”
- Enrichment with geocodes of countries, province and large city names
- Starting an export file containing number of tweets per location (polygon), the reliability of the tweets and the URLs to the tweets (for manual validation)
- Quantify reliability by comparing the Global Flood Monitor (both flood repoerts and geocode) with other flood information sources.
This delivers a very first global flood monitor using Twitter. To improve the reliability (further reduction of false positives/ negatives) and accuracy (location) of the data, the next steps in further development are recommended:
- Improve reliability of the flood reports by improving the search query and/ or training and using a classifier
- Improve reliability of geocoding by developing better strategies to cope with location names that are ambiguous (e.g. the province “North” in Singapore)
- Improve detail of geocoding by including lower levels of aggregation, e.g. down to municipality level.
- Improve filtering of the flood reports by using a user query. This includes assessment of the added value/ reliability of individual users, by (machine-) learning using the positives from the search query (possibly with improved reliability indication).
Hereunder the project approach in detail:
Creating a filter
There are roughly two ways to filter content:
- Filter on the basis of the tweet user: This was actually our initial idea, to create a white list of users that can be trusted and used as flood detector. After some experiments we found out that indeed the number of false positives was small, but we did not come close to a global overview. This approach needs much time spent on the creation of the champions’ list, to make sure we don’t miss (too many) events in small countries and remote areas.
- Filter on the basis of the tweet content: This can be done by a simple query or by a classifier (following a procedure of supervised machine learning using clustering, annotation and classifying). As the current classifiers are built leaning towards false negatives than false positives, for this purpose of global flood monitoring, we decided to continue and use the simple query. After some trial and error here is the full query that we used:
(leave AND dead) OR (Death AND rises) OR ("Floods hit") OR ("Rain cause*") OR (Dead AND after) OR ("killed after") OR ("Feared dead") OR (“floods kill”) NOT 19?? NOT 20?? NOT january NOT february NOT march NOT april NOT may NOT june NOT july NOT august NOT september NOT october NOT november NOT december NOT last NOT cry NOT expected NOT warning NOT emotions NOT "could flood" NOT "could cause" NOT "road flood" NOT (hope AND doesn't AND cause) NOT "may cause" NOT "may flood" NOT potentially NOT "historic floods" NOT "video tip" NOT when NOT ("no flood") NOT ("to be") NOT ("don't have flood”)
Enrichment with a geocodeWe decided to start monitoring at the level of country, province and large cities. For countries and provinces we used data from http://gadm.org (256 countries and 3.609 provinces). For the large cities we used the populated places list of www.naturalearthdata.com (total 7.342 cities). To avoid errors in the geocoding we took the following approach:
- Location names that also have other meanings: Such as the province ‘Pool’ in the ‘Republic of Congo’. To avoid this we excluded all location names that are less than 4 characters long (total 655 names) + location names that are also frequently used words in the English language (such as central, western, northern, southern, north, south, capital, central-coast, capital, alert but also far-western, western cape, green bay, bay city and others). To improve the geocoding, more work must be done to exclude ambiguous words from the location names list of >4 characters) and include unambiguous words from the list of <5 characters.
- Location name referring to more than one location (double names): There are doubles in the total list of locations (names of cities, provinces, countries that are alike). When a tweet comes in that has multiple locations our procedure is that we first look for country names within the tweet itself (a combination of ‘Alexandria’ and ‘Romania’ refers to Alexandria in Romania and not Alexandria in Egypt). If there are none, we do a similar search over the past 48-72 hours (previous tweets where Alexandria appeared with another location name, such as ‘Romania’). The location with the largest ‘count’ of such combinations will be set as the location of the tweet.
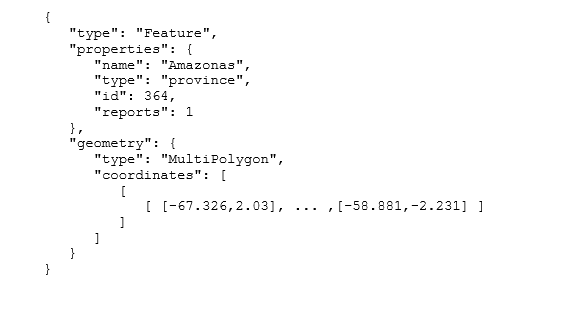
- Tweets with more than one location name: This happens when 1. There are more than one locations flooded (Detroit and Phoenix) or 2. One location lies within another (Amazonas and Brazil). When more than one locations are flooded, the tweet obtains two geocodes (for Detroit and Phoenix). When one location lies within another, the tweets obtains the geocode of the smallest polygon (Amazonas). For example, when we receive a tweet text with: “There is a flood happening in Amazonas, Brazil”, we will find the locations in this tweet as “Amazonas” and “Brazil”. Since Amazonas lies within Brazil, the tweet will be enriched with the geocode of Amazonas (and not Brazil). As such:
ExportfileThe export file is a GeoJSON containing the number of filtered tweets per location, posted on Twitter in the previous five minutes. Per location also the reliability is given plus the URLs to the individual tweets. Note that if there are no floods reported in the past five minutes, there will be no features listed in the features array of the export file. Hereunder an example export file:
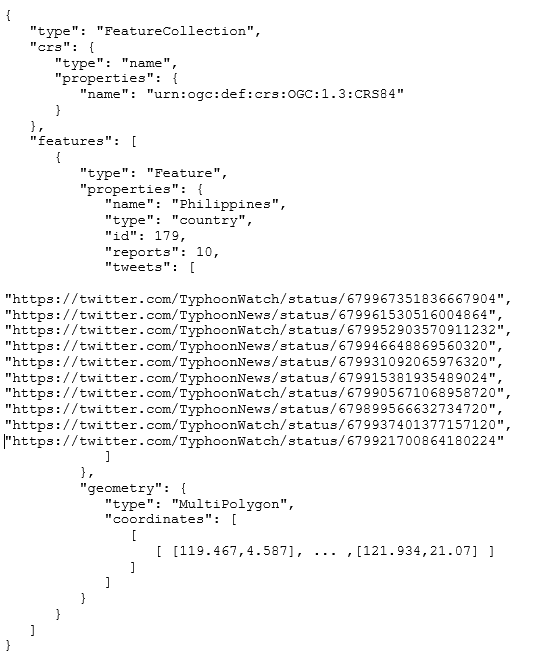
Note that the export file contains counts of filtered tweets with a reliability indication. At this moment we cannot ‘confirm’ a flood. If a user needs to be 100% of a flood happening, it needs to be validated first.
DatamanagementHereunder the dataflow between collection of data from Twitter to export of the GeoJSON to the eventserver:
- Collection of data from the Twitter API, using the developed query
- Per tweet, recognition of the query term that the tweet came in through
- Application of a number of enrichments:
- Reliability (on the basis of previous validation)
- Adding geocode for a tweet (following the above discussed approach)
- Recognition of number of features of the tweet, including whether it is a retweet, a modified tweet (determined as such when an identical string of five words was found in previous 10.000 tweets) and whether the tweets contains a photo, a URL (and which URL) and whether the body text of the tweet contains a water depth mention (and which water depth).
- Storage of the full tweet including enrichments into a MongoDB. Storage of a stripped version of the tweet in an ElasticSearch database.
- From the ElasticSearch database, each five minutes a GeoJSON export file is generated and sent to the eventserver using RabbitMQ protocol.
The software has been set-up generally and can be used for other topics as well, as long as the approach required is similar (looking for global coverage, avoiding false postives, allowing for false negatives). What we did not automate (and in any case must be done for a new topic) is 1. Create a search query for the topic to be monitored and 2. Determine reliability per part of the search query and 3. Any further detailing of the geocode (adding new locations such as municipalities etc) would require additional work.
Result
In this project we realised a
- Datafeed to the ‘eventserver’
- A dedicated display in the FloodTags explorer so that events can be validated by manually checking the tweets and links in the tweets
- Display in ID-lab
- Animation of floods for interesting period
The data can now be used by users of the ID-lab and third parties that are listening to the event server. If there is demand for improvement of the reliability of the data (further reduction of false positives/ negatives), we recommend the following:
- Improve the search query and/ or improve the filtering process by training and using a classifier (uses more features of a tweet for filtering)
- Improve the filters by using a user query. This includes finding champions (users sending tweets that after filtering result in none/ very few false positives and false negatives) using machine-learning from the true positives (on basis query text).
- Improve geocoding by including lower levels of aggregation, such as municipality level.
- Improve reliability quantification by combining the reliability from semantic validation (looking for search query only) with other information sources